Regression Toward Keppel
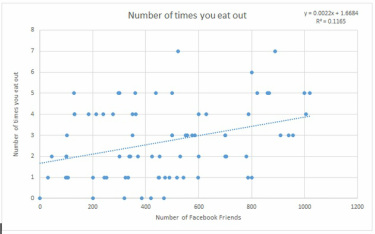
In this assignment, I worked with my statistics group to find out how related two random variables of interest are. The variables we chose were the number of times you eat out and the number of Facebook friends you have. The goal of this project was to find the least square regression line, or line of best fit, that describes our surveyed data points. From this regression line, we determined the a value (expected number of Facebook friends you have if you do not eat out in a week), the slope (expected number of times you eat out in a week with every additional Facebook friend), and the correlation value, r (measure of of strong the relationship between two variables are). In the end, we discovered that our r=3413, which means that our variables of interest , were not very related at all.
In this assignment, I worked with my statistics group to find out how related two random variables of interest are. The variables we chose were the number of times you eat out and the number of Facebook friends you have. The goal of this project was to find the least square regression line, or line of best fit, that describes our surveyed data points. From this regression line, we determined the a value (expected number of Facebook friends you have if you do not eat out in a week), the slope (expected number of times you eat out in a week with every additional Facebook friend), and the correlation value, r (measure of of strong the relationship between two variables are). In the end, we discovered that our r=3413, which means that our variables of interest , were not very related at all.
| fairy_tale.docx |
Statistics Fairy Tale
In this project, I worked with my statistics group to rewrite a famous fairy tale in our own words and using statistical terminology. The goal of this project was to be able to explain what is statistics in a simplistic way so that even a seven - year - old would be able to understand what we are learning in class. We based our fairy tale off the original fairy tale "The Little Mermaid" by Hans Christian Andersen. The main statistics topics we covered in the fairy tale were random variables, linear regression, normal distributions, calculating probabilities, and finding z - scores. After completing this project, I find it significant that my group and I were able to review what we have learned by trying to teach a rather difficult topic to a young audience.
In this project, I worked with my statistics group to rewrite a famous fairy tale in our own words and using statistical terminology. The goal of this project was to be able to explain what is statistics in a simplistic way so that even a seven - year - old would be able to understand what we are learning in class. We based our fairy tale off the original fairy tale "The Little Mermaid" by Hans Christian Andersen. The main statistics topics we covered in the fairy tale were random variables, linear regression, normal distributions, calculating probabilities, and finding z - scores. After completing this project, I find it significant that my group and I were able to review what we have learned by trying to teach a rather difficult topic to a young audience.
